Programas / Software
MLMapper
What is MLMapper?
MLMapper is a QGIS plugin for predictive mapping. MLMapper uses machine learning algorithms to establish statistically-significant patterns between a point-source binary target variable and a series of potentially explanatory variables. The outcomes are then extrapolated to every pixel in the map.
For instance, MLMapper may be used to make a groundwater potential map by combining satellite raster information (evapotranspiration, landforms, geology, soil, slope, etc) and point-source ground-truth (a borehole database). Machine learning algorithms are used to establish patterns between raster and point-source data. Then the results are extrapolated to the entire region.
Dependencies
MLMapper was originally developed as a stand-alone Python 3.6 application, and later incorporated as a QGIS 3 plugin. To run, MLMapper requires the following software to be installed in your computer:
- QGIS 3
- The numpy and matplotlib Python libraries, which are typically installed along with QGIS.
- Updated versions of the pandas and sklearn Python libraries should be present in the site-packages directory of your QGIS installation (see below).
Installation instructions
Please make sure that you have read the "dependencies" heading and installed the required software first. Then:
1. Download the required libraries from MLMapper"s GitHub repository. These do not come along with the standard QGIS installation, and may be installed using one of the following procedures:
a) Install them via pip using the OSGeo4W shell (recommended);
b) Failing that, you may copy the six libraries contained in the GitHub repository directly into the site-packages directory of your QGIS installation (the six libraries are: pandas-0.23.0.dist-info.rar, pandas.rar, scikit_image-0.13.1-py3.6.egg-info.rar, scikit_learn-0.19.1-py3.6.egg-info.rar, skimage.rar and sklearn.rar). Each one should be unzipped into a separate folder within the site-packages directory. Each folder should be named after the downloaded file minus the .rar extension (i.e. pandas.rar should be unzipped to the "(...)//site-packages/pandas/" folder).
2. Download MLMapper.rar from the GitHub repository. Unzip its contents into a separate folder named mlmapper in QGIS plugin directory (by default: C:\Users\AdministratorName\AppData\Roaming\QGIS\QGIS3\profiles\default\python\plugins)
3. Open QGIS and access the plugins menu. Go to manage and install plugins. In the search bar type MLMapper. It should show. Activate it by clicking on the empty box next to MLMapper and close the window.
4. A white button labelled "ML" should be added to your QGIS toolbar (you may have to restart QGIS for this to show). MLMapper can also be accessed from the plugin menu.
Running MLMapper
Open QGIS and click the ML button on your toolbar. This window will pop up:
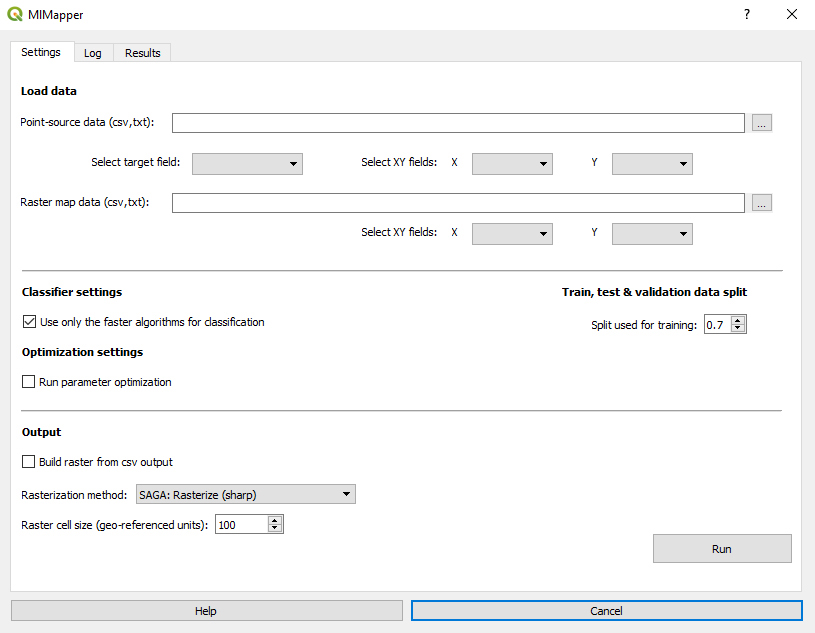
Only two datasets are needed. (1) The point-source dataset, including the target variable and the pixel score of each point in each layer; and (2) the entire array of pixel values for each explanatory variable layer in the GIS database. Both files should include headers and should have the columns arranged in the same order.
The target variable, as well as the x and y columns should be specified.
The remaining settings are optional. The user may decide whether to use all machine learning classifiers or just the fast ones (better for slow CPUs or for very large datasets), and wheter to run automatic parameter optimization to reduce overfitting. Furthermore, the user may decide upont the train/validation/test split.
Finally, the output may be presented as a csv file (by default) or rasterized via SAGA"s rasterization and multilevel b-cubic spline interpolation.
MLMapper outputs
MLMapper presents three types of outputs:
- Predictive rasterized map: This consist in the extrapolation of those patterns found by machine learning classifiers to every pixel in the database. By default MLMapper renders the ensemble mean of all classifiers, but the results of a given classifier may be plotted separately from the output.csv file. For MLMapper to build a raster map, the build raster from output option must be checked.
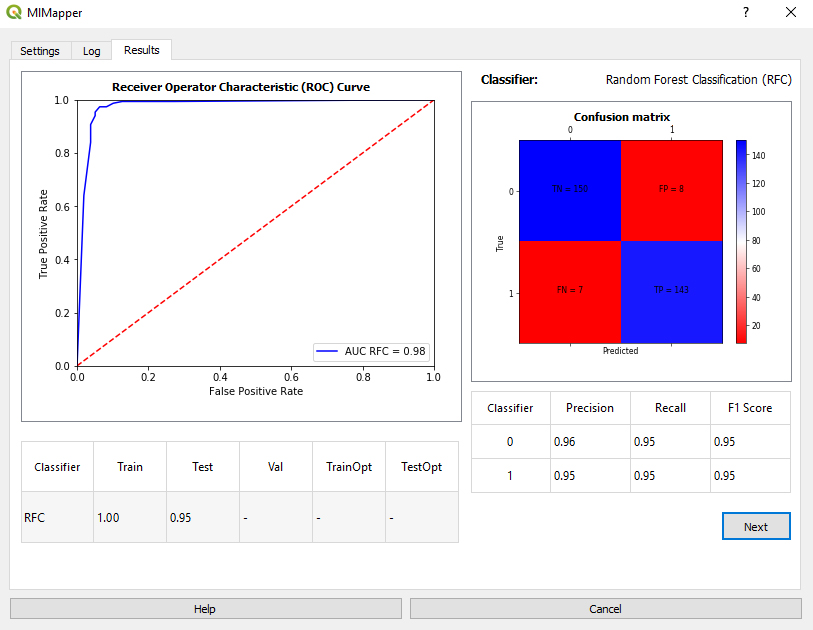
- Graphic metrics: For binary problems and for each classifier, MLMapper produces receiver operator characteristic curves (ROC curves), as well as the confusion matrix. These are shown automatically in the Results tab after running the program.
- Numerical metrics: MLMapper renders the training, validation and test scores obtained by each classifier.
Graphic and numerical metrics are all saved together in the plugin output folder. Each graph is named after its classifier, while the numerical metrics are saved to the summary.csv file.
Operation instructions
Download sample datasets here
The MLMDataset.rar file must be unzipped prior to working with its contents, and contains two datasets:
The point_source_data file contains data for over 1000 boreholes in a region of southern Mali. The target variable (Trss) is binary and represents borehole success (1) or failure (0). Explanatory variables include drainage density, geology, land use/land cover, landforms, lineament density, lineament distance, NDVI, distance to a permanent stream, distance to an ephemeral stream, rainfall, slope, soil and topographic wetness index. This file is used by machine learning algorithms to find those patterns leading to positive and negative boreholes.
The raster_pixel_data file contains the information for every pixel in each layer outlined above (drainage density, geology, etc). This information will be used to extrapolate the patterns found by machine learning algorithms, thus leading to a success/failure prediction for every pixel in the region.
You are welcome to explore both input files in order to better understand what is going on when you run MLMapper.
MLMapper operation instructions
0. Download the files above and load the MLMapper plugin in QGIS as per the instructions to the left.
1. Open a new project in QGIS.
2. Load the point-source dataset: Layer > add layer > add delimited text layer > Open Forages02xy.csv > select "comma separated values" >> Add
[This will simply load the point source database for you to see the spatial distribution]
3. Click twice on the name of the layer you just loaded (point_source_data). A window will pop up. Go to symbology > select categorized > column "Trss" > classify > apply
[This will display the positive ("1") and negative ("0") boreholes in different colors]
4. Open MLMapper either by clicking the button in the toolbar or by accessing the dropdown plugin menu: plugins > mlmapper > mlmapper
5. In the MLMapper window select the point-source and raster datafiles you just downloaded (remember to unzip the raster data file first). The target, x and y fields will be filled automatically.
6. Check the build raster from csv output box and select SAGA:rasterize (sharp) as rasterization method. Then click run.
[The plugin engine will automatically run, showing you the log. If you check the run parameter optimization box, or uncheck the use only the faster algorithms for classification option the process could take over 10-15 minutes. During this time your computer may look like it has stalled. Be patient. :) ]
7. MLMapper will take you to the results tab automatically. You may click the next button to evaluate the results obtained with each machine learning classifier. Additionally, MLMapper will render a predictive map (a horizontal rectangle) in the main QGIS screen. This is the result of extrapolating the patterns found by machine learning algorithms to each pixel in the raster pixel data file.
8. You may wish to drag the newly-created rasterized layer below the point_source_data layer to see them both simultaneously.
And that"s it. This has been a basic tutorial to predictive mapping with MLMapper. Now it"s just a matter of exploring its functionalities with your own maps.